[Product feature series]
One-click access to TensorBoard for model development and experimentation
August 13, 2019
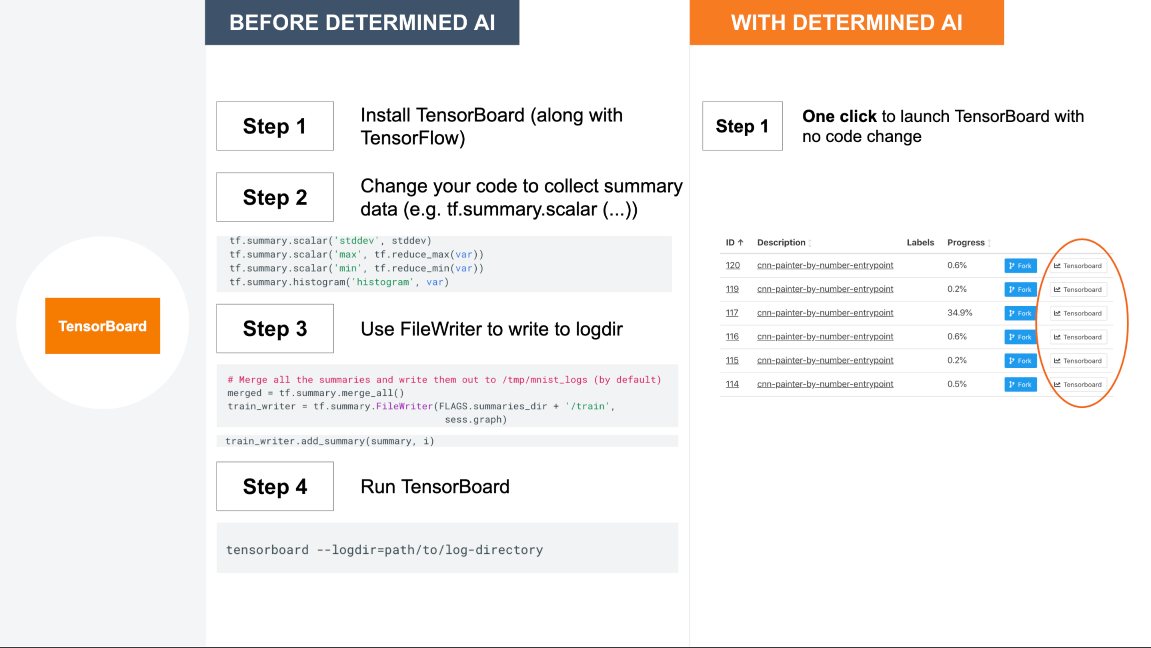
Training a massive deep neural network can be daunting. Many deep learning (DL) engineers rely on TensorBoard for visualization so that they can better understand, debug, and optimize their model code. Using TensorBoard, you can visualize and compare experiment metrics, and diagnose everything from vanishing gradients to exactly when your models start overfitting. Determined AI lets you access TensorBoard in one-click (see Figure 1 below).

In Determined AI terms, an experiment is a collection of one or more DL training tasks that correspond to a unified DL workflow, e.g., exploring a user-defined hyperparameter space. Each training task in an experiment is called a trial. As you run your experiments on Determined AI, you can easily go to the Experiments tab of our UI and find the experiment you want to visualize. Simply click on the TensorBoard button next to the desired experiment and you will see a TensorBoard session appear in your browser. Or you can run the following command in Determined’s command line interface:
$ det tensorboard start <experiment_id> # loads all trial metrics for an experiment
The associated TensorBoard server is launched in a containerized environment on the Determined AI managed cluster of GPUs. Determined AI proxies HTTP requests to and from the TensorBoard container through our master node. More details can be found in our documentation.
TensorBoard operates by reading event files, which contain summary data. Without Determined AI, you’d have to explicitly generate summary data by logging them through the tf.summary APIs and using a FileWriter to write them to the event files before you can visualize them. If you want to preserve these files historically, you’d need to manually manage the log directories and keep track of which experiments they correspond with. Determined AI simplifies the process by automatically logging the metrics you defined in your model code as training metrics and/or validation metrics, e.g., error, loss, and accuracy. You do not have to log these data separately using the tf.summary APIs. Besides showing these metrics, we plan to support image summaries and neural network graph visualization on TensorBoard in the near future.
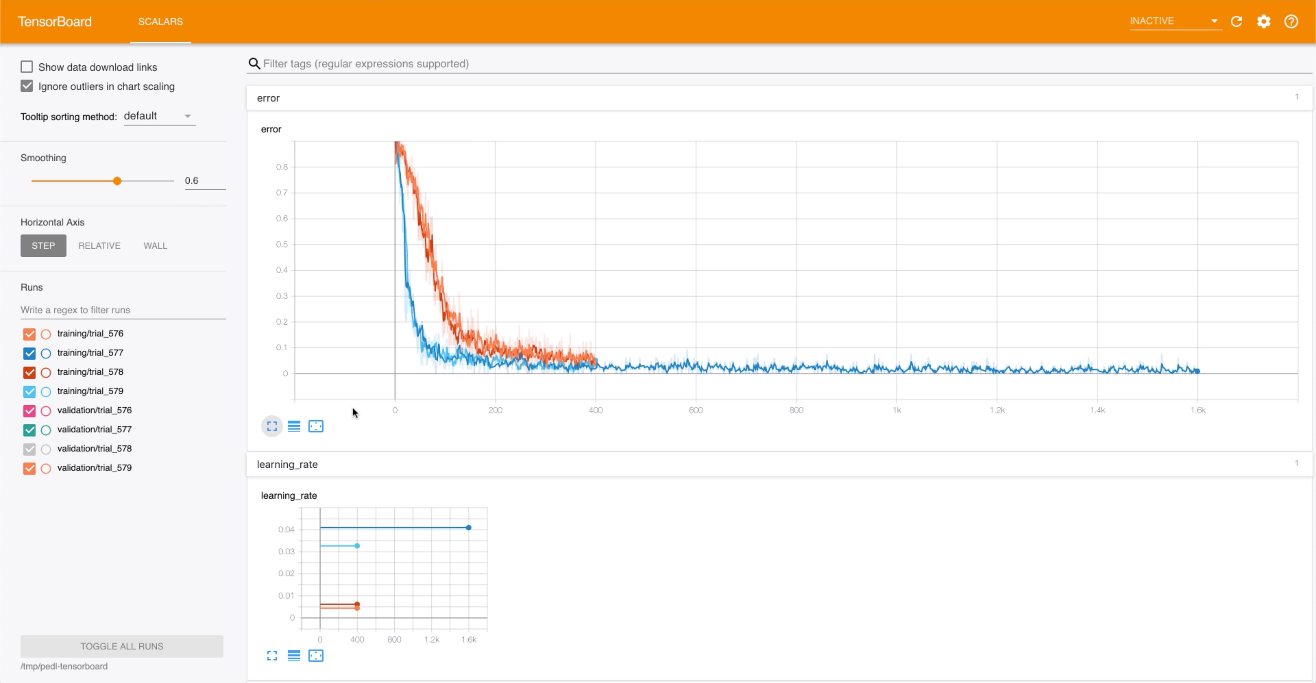
To make it easy for DL engineers to compare the performance across multiple trials, Determined AI groups the metrics of all the trials in one experiment for visualization. You can then visualize the metrics on the same graph, and thus expedite your early-stage model development and experimentation. If you want to visualize the metrics of just a few trials you can issue the command below with a list of specific trial IDs:
$ det tensorboard start --trial-ids <list of trial IDs>
This screencast goes into more details on visualizing the metrics for all trials pertaining to an adaptive search in a user-defined hyperparameter space. The TensorBoard visualization in Figure 2 below shows the early stopping behavior of adaptive search, along with the error and learning rate across multiple trials.

At Determined AI, our goal is to simplify your DL model development lifecycle and drive DL performance and productivity. Our integration with TensorBoard enables you to easily visualize your DL experiments so that you can expedite your model development and converge to a good model faster and cheaper.
